COVID-19 in Russia
The first post is about COVID19 in Russia.
Data source
The dataset used in this post is from World Health Organization (WHO)(WHO 2020) and the data source is Russian Federal State Statistics Service.
About Russia
WHO classifies COVID-19 transmission in Russia as clusters of cases. WHO defines clusters of cases as “cases that are clustered in time, geographic location and or by common exposures”.
Russia has 146,748,590 people. It has large country area but only a small proportion of the areas in which people are willing to live. This could be one of reasons of clusters of cases in Russia. Fig1 shows the COVID-19 cases reported in Russia since 31st, Jan 2020; we can see that the largest number of new cases was on 27th Apr (12559 new cases on this day).
Figure 1: COVID-19 cases reported in Russia since 2020-01-31
Table 1 shows the statistic summary of four variables — new cases, cumulative cases, new deaths, and cumulative deaths. The max of cumulative cases and cumulative deaths means the latest numbers, while the max of new cases and new deaths shows the peaks for these two variables. This table is not informative enough. So, I draw a boxplot (Fig2). The boxplot uses y-axis scales and transformations because when I put deaths and new cases in a same plot, the deaths can be hardly seen if they share same y-scale. The boxplot for new cases is left-skewed, which means newly reported cases are still high. In other words, Russia government is trying to control the virus spreading but does not succeed yet.
| vairble | min | Q1 | median | mean | Q3 | max |
|---|---|---|---|---|---|---|
| new_cases | 0.00 | 53.75 | 5224.00 | 4647.86 | 7743.50 | 12559.00 |
| Cumulative cases | 6 | 438 | 267443 | 355441 | 695871 | 985346 |
| new_deaths | 0.00 | 0.00 | 91.50 | 80.31 | 135.75 | 232.00 |
| Cumulative deaths | 0 | 0 | 2478 | 5310 | 10537 | 17025 |
Figure 2: Boxplot for four cumulative cases, cumulative deaths, new cases, and new deaths
Fig3 supports my conclusion above. Some pitfalls in the red line indicates the test results were not reported at these days.
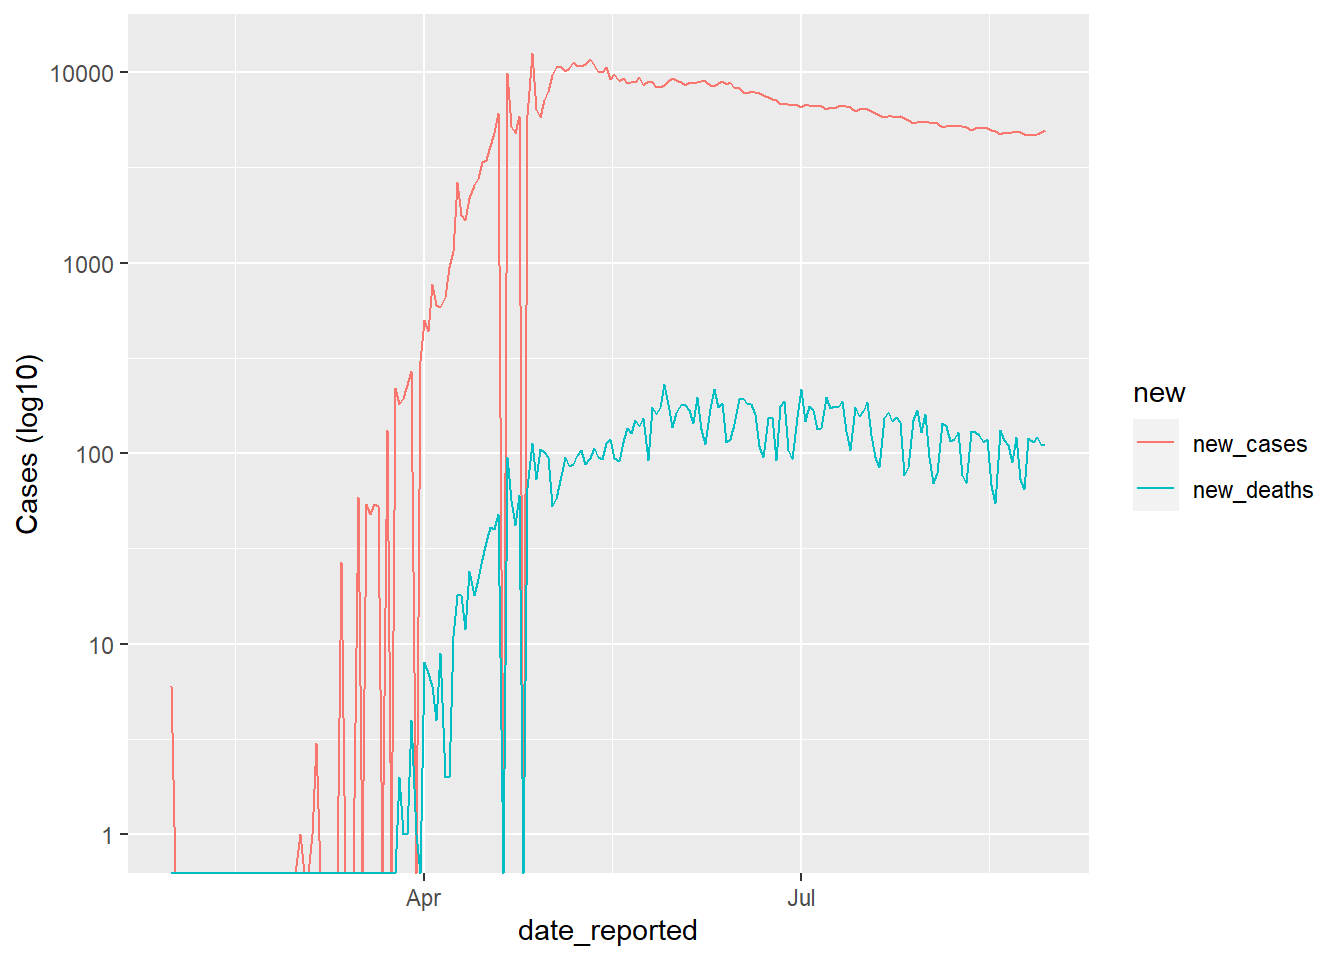
Figure 3: Line plot illustrates the new cases and new death trend in Russia since 2020-01-31
My viewpoint
The bad situation in Russia will continue affecting its economy in at least next six months. Russia’s economy is vulnerable and Russia government wants eagerly to do their best for reopen their markets. Russia president, Putin, even allowed the coronavirus vaccine to skip crucial trials (i.e. testing in a larger number of humans to confirm its effectiveness) and claimed one of his daughters had been jabbed (Cockburn 2020). All these actions are becuase Russia cannot wait any longer. However, the bad news is covid-19 is mutated along time (Groch and Mannix 2020). We don’t know whether the vaccine will be still effective in future, even in next month.
Acknowledgements
The packages used for producing this post are:
tidyverse (Wickham et al. 2019), janitor (Firke 2020), plotly (Sievert 2020), DT (Xie, Cheng, and Tan 2020), knitr (Xie 2014), kableExtra (Zhu 2019), readr (Wickham, Hester, and Francois 2018)
References
Cockburn, Paige. 2020. “Why Development of Russia’s Covid-19 Vaccine Is ’Reckless’.” ABC News. ABC News. https://www.abc.net.au/news/2020-08-13/australian-experts-react-to-sputnik-vaccine-news-reckless/12552028.
Firke, Sam. 2020. Janitor: Simple Tools for Examining and Cleaning Dirty Data. https://CRAN.R-project.org/package=janitor.
Groch, Sherryn, and Liam Mannix. 2020. “The Same Coronavirus Strain Turned up in an Australian and a Tiger. How?” The Sydney Morning Herald. The Sydney Morning Herald. https://www.smh.com.au/national/the-same-coronavirus-strain-turned-up-in-an-australian-and-a-tiger-how-20200622-p554wq.html.
Sievert, Carson. 2020. Interactive Web-Based Data Visualization with R, Plotly, and Shiny. Chapman; Hall/CRC. https://plotly-r.com.
WHO. 2020. “WHO Coronavirus Disease (Covid-19) Dashboard,” August. https://covid19.who.int/table.
Wickham, Hadley, Mara Averick, Jennifer Bryan, Winston Chang, Lucy D’Agostino McGowan, Romain FranC’ois, Garrett Grolemund, et al. 2019. “Welcome to the tidyverse.” Journal of Open Source Software 4 (43): 1686. https://doi.org/10.21105/joss.01686.
Wickham, Hadley, Jim Hester, and Romain Francois. 2018. Readr: Read Rectangular Text Data. https://CRAN.R-project.org/package=readr.
Xie, Yihui. 2014. “Knitr: A Comprehensive Tool for Reproducible Research in R.” In Implementing Reproducible Computational Research, edited by Victoria Stodden, Friedrich Leisch, and Roger D. Peng. Chapman; Hall/CRC. http://www.crcpress.com/product/isbn/9781466561595.
Xie, Yihui, Joe Cheng, and Xianying Tan. 2020. DT: A Wrapper of the Javascript Library ’Datatables’. https://CRAN.R-project.org/package=DT.
Zhu, Hao. 2019. KableExtra: Construct Complex Table with ’Kable’ and Pipe Syntax. https://CRAN.R-project.org/package=kableExtra.