COVID-19 in Mexico
Data source
The dataset used in this post is from World Health Organization (WHO)(WHO 2020) on 15-09-2020.
Background story
Mexico and the U.S are neighbours. Because the U.S is much more developed than Mexico, there are many illegal immigrants from Mexico go across the border and live and/or work in the U.S.. The drug trafficking in Mexico is notorious. They commit crimes and the government can do little about them. However, surprisingly, during the coronavirus pandemic, criminal cartels provide food to poors and help hospitals procure the necessary equipment (Pazzona 2020). This strange story occurs mainly because of two reasons. First, the Mexico government does not have the capacity to organise effective operations to help poor people or hospitals. Second, the gangs’ income is decreasing due the coronavirus pandemic. So, they eagerly want the society back to normal.
Like the U.S, the transmission classification in Mexico is community transmission as well (fig 1 shows the location of Mexico). Community transmission means the government lacks capacity to control the coronavirus pandemic or the residents do not follow the rules.
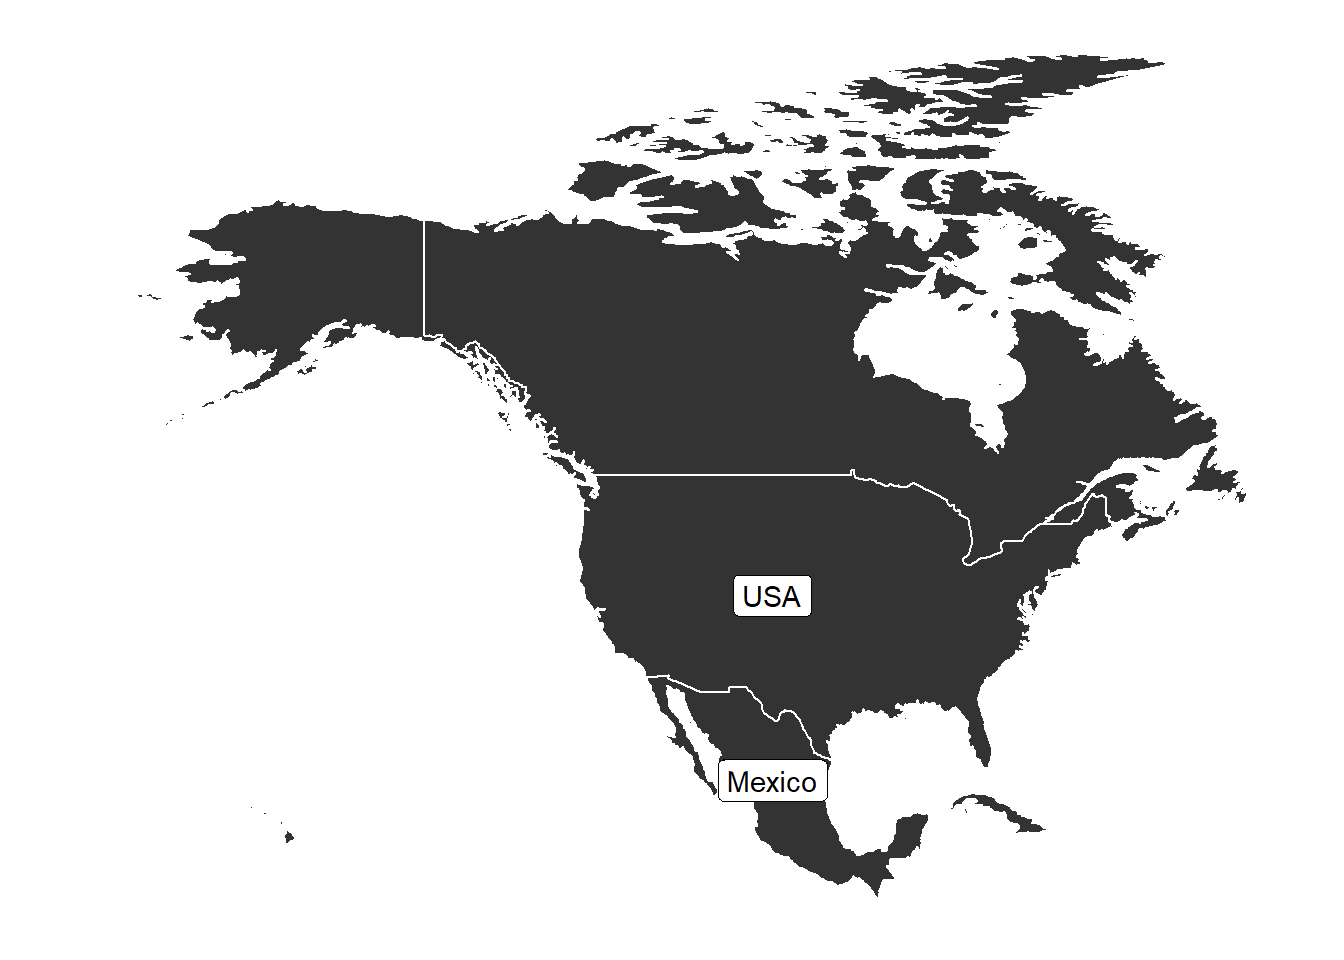
Figure 1: Mexico and USA
What does the data tell us
Fig 2 shows the Date, New cases, Cumulative cases, New deaths, and Cumulative deaths of Mexico. Unlike Russia, the earliest date reported of Mexico was the end of February 2020. The highest daily new cases was 9556 on 3rd Aug 2020. The highest daily new deaths was 1091 on 5th Jun 2020.
Fig 3 shows the red line (New cases) increased dramatically after 1st Apr 2020. Daily new deaths is also surprisingly high; until now, the average of new deaths is 353.02. The high daily new cases will overwhelming Mexico’s hospitals and medical resources.
Fig 4 shows that Mexico’s cumulative cases was at 7th highest globally, but its cumulative deaths was at 4th highest globally. So far, Mexico’s death toll from the pandemic is the 13th highest on a per capita basis (Garcia and Gutierrez 2020). According to World Bank database, Mexico’s hospital beds (per 1,000 people) was only 1.5 in 2015. As we know, the availability of CCB-ICU beds, mechanical ventilation and ECMO devices are critical for saving lives in the coronavirus pandemic. But the treatment is expensive, as well as the test. According to the World Bank, the poverty headcount ratio at national poverty lines (% of population) of Mexico was 41.9%. This is crucial because even poor people know they are infected, they can’t afford the treatment. In addition, because of coronavirus pandemic, people can hardly find a job — they have no income.
Figure 2: COVID-19 cases reported in Mexico since 28-02-2020
Figure 3: Daily new cases and new deaths in Mexico
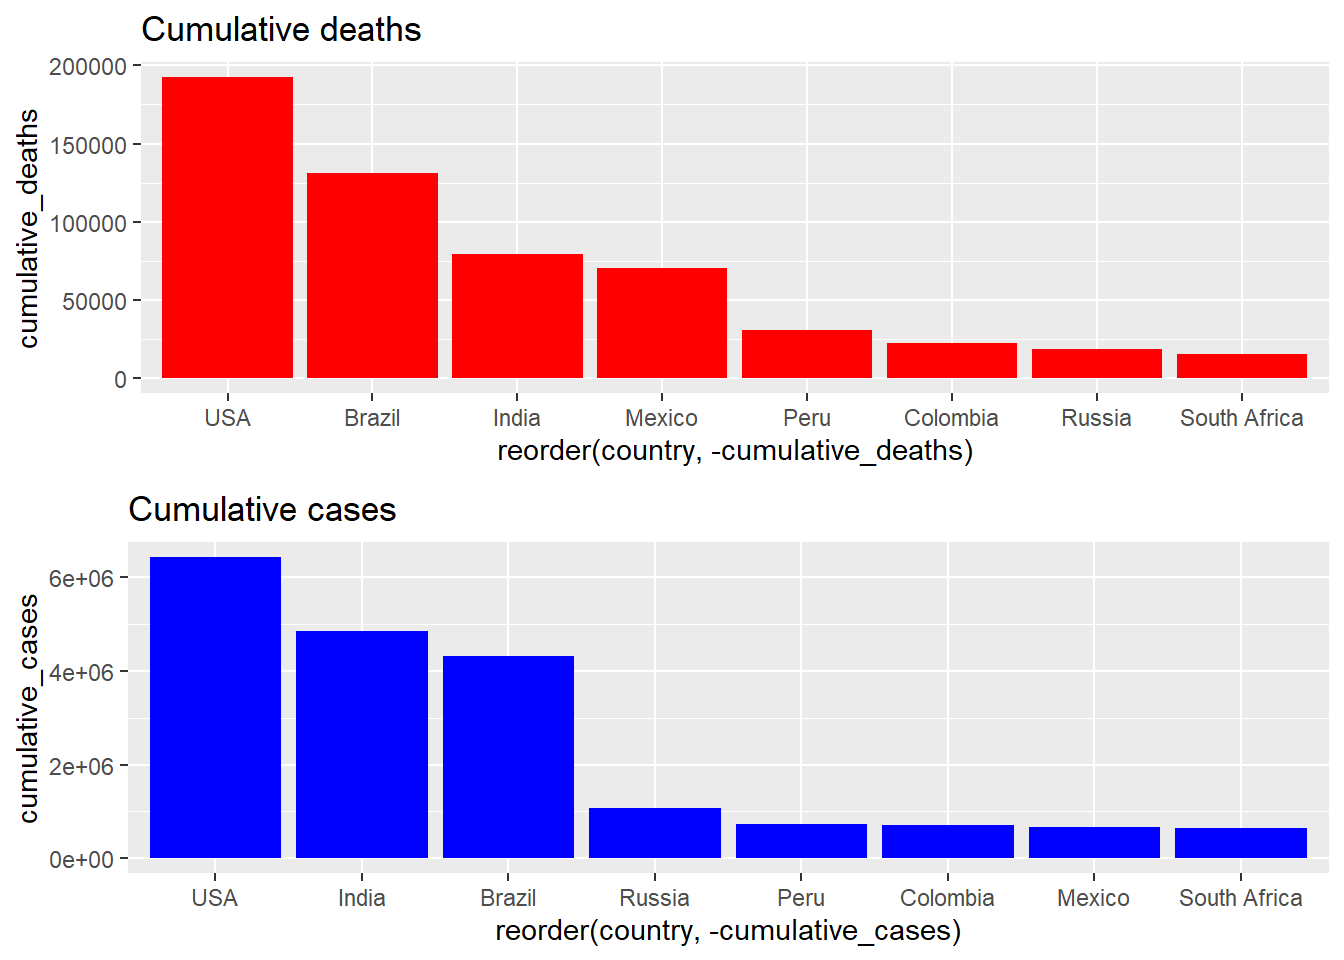
Figure 4: Cumulative cases vs. Cumulative deaths on 15-09-2020
My viewpoint
The global coronavirus pandemic slows down global ecnomy dramatically in 2020, and the situation may last for years. The control ability and the efficiency of governments and the industrial power of countries are tested in the circumstance. Latin American countries don’t have strong industrial base, so they can’t manufacture important medical devices by themselves. Most of the medical equipments are imported. The hopital beds per 1000 people is an indicator which represents the ability that a country dealing with the emergency situation like this time. Also, the cooperation of residents is important as well. In order to pass the difficult time, people must follow the instructions of national health department.
Acknowledgements
The packages used for producing this post are:
tidyverse (Wickham et al. 2019), janitor (Firke 2020), plotly (Sievert 2020), DT (Xie, Cheng, and Tan 2020), knitr (Xie 2014), readr (Wickham, Hester, and Francois 2018), ggmap (Kahle and Wickham 2013), ggthemes (Arnold 2019), gridExtra (Auguie 2017)
The poverty data and hospital bed data are gathered from the World Bank open data (Knippenberg et al. 2020)
References
Arnold, Jeffrey B. 2019. Ggthemes: Extra Themes, Scales and Geoms for ’Ggplot2’. https://CRAN.R-project.org/package=ggthemes.
Auguie, Baptiste. 2017. GridExtra: Miscellaneous Functions for "Grid" Graphics. https://CRAN.R-project.org/package=gridExtra.
Firke, Sam. 2020. Janitor: Simple Tools for Examining and Cleaning Dirty Data. https://CRAN.R-project.org/package=janitor.
Garcia, David Alire, and Miguel Angel Gutierrez. 2020. “Mexico’s Confirmed Coronavirus Deaths Rise to 70,604.” Msn. https://www.msn.com/en-au/lifestyle/wellbeing/mexico-s-confirmed-coronavirus-deaths-rise-to-70-604/ar-BB18YobE.
Kahle, David, and Hadley Wickham. 2013. “Ggmap: Spatial Visualization with Ggplot2.” The R Journal 5 (1): 144–61. https://journal.r-project.org/archive/2013-1/kahle-wickham.pdf.
Knippenberg, Erwin, Emi Suzuki, John Baffes, and E. Purdie. 2020. “World Bank Open Data.” Data. The World Bank. https://data.worldbank.org/.
Pazzona, Matteo. 2020. “Coronavirus: Crime Cartels Helping Communities Will Extract a High Price in Years to Come.” The Conversation. https://theconversation.com/coronavirus-crime-cartels-helping-communities-will-extract-a-high-price-in-years-to-come-138592.
Sievert, Carson. 2020. Interactive Web-Based Data Visualization with R, Plotly, and Shiny. Chapman; Hall/CRC. https://plotly-r.com.
WHO. 2020. “WHO Coronavirus Disease (Covid-19) Dashboard,” August. https://covid19.who.int/table.
Wickham, Hadley, Mara Averick, Jennifer Bryan, Winston Chang, Lucy D’Agostino McGowan, Romain FranC’ois, Garrett Grolemund, et al. 2019. “Welcome to the tidyverse.” Journal of Open Source Software 4 (43): 1686. https://doi.org/10.21105/joss.01686.
Wickham, Hadley, Jim Hester, and Romain Francois. 2018. Readr: Read Rectangular Text Data. https://CRAN.R-project.org/package=readr.
Xie, Yihui. 2014. “Knitr: A Comprehensive Tool for Reproducible Research in R.” In Implementing Reproducible Computational Research, edited by Victoria Stodden, Friedrich Leisch, and Roger D. Peng. Chapman; Hall/CRC. http://www.crcpress.com/product/isbn/9781466561595.
Xie, Yihui, Joe Cheng, and Xianying Tan. 2020. DT: A Wrapper of the Javascript Library ’Datatables’. https://CRAN.R-project.org/package=DT.